Today we are going to take a look at how to install Grafana on a Synology NAS using Docker.
Grafana is a tool that allows you to make tons of different customized dashboards. It’s slowly become a favorite for people running home labs or different services inside of their house. This is a pretty easy tool to self-host on a Synology NAS, so today we’re going to look at how to install and configure it!
Instructions – How to Install Grafana on a Synology NAS
1. Install Docker from Synology’s Package Center.
2. Inside of the docker folder, create a folder named grafana. This is where we will store all of the container’s data.
3. Ensure you can SSH into your Synology NAS. Open Control Panel, select Terminal & SNMP, and Enable SSH service. If you are using Synology’s Firewall, ensure that you allow port 22 traffic. I created a video on how to SSH into your Synology NAS if you have any problems.
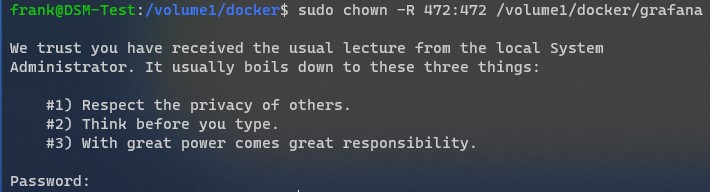
4. Run the command below to change the owner of the folder to the owner’s ID (472) currently running the container. This will ensure the volume stays persistent.
sudo chown -R 472:472 /volume1/docker/grafana
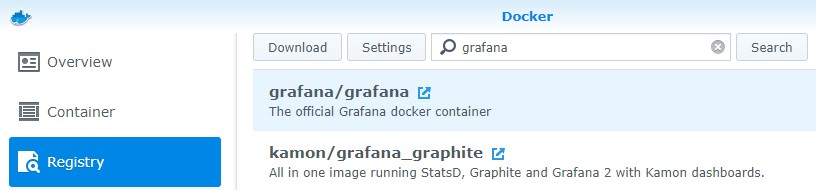
5. Open Docker, select Registry, then download the latest grafana/grafana image.
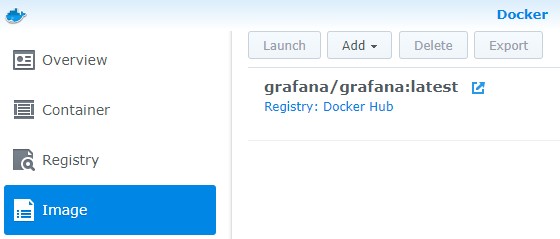
6. When the download finishes, double-click it from the Image section to launch the configurator.
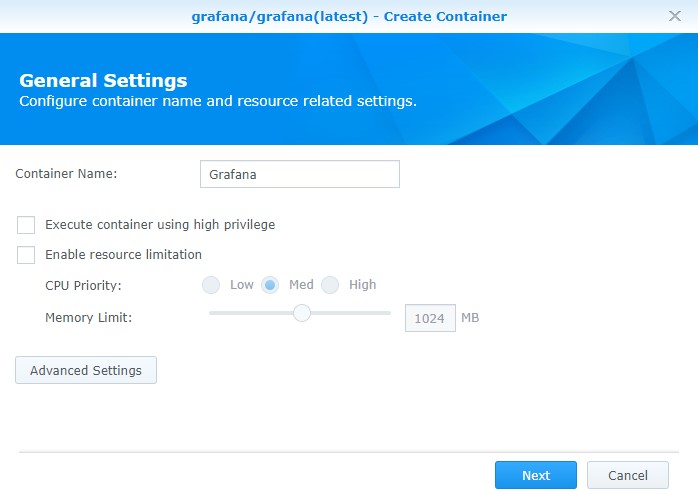
7. Give the container a name and select Advanced Settings.
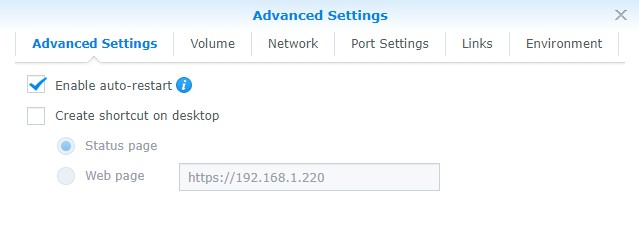
8. Select the box to Enable auto-restart.
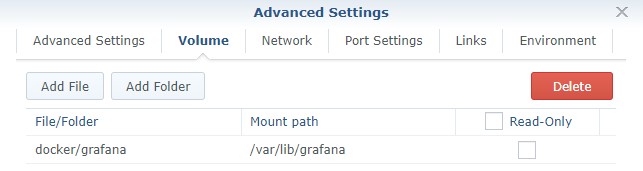
9. In the Volume section, add the grafana folder that we created earlier. Set the mount path as /var/lib/grafana.
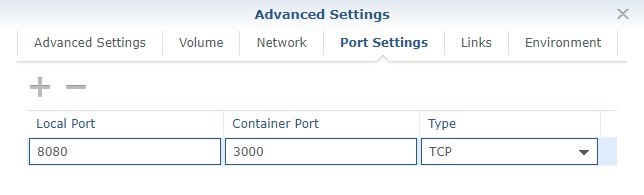
10. In the port settings, change the default port from auto to 8080. NOTE: If you’re using port 8080 for a different service, you’ll have to use a port that’s not currently in use.
11. Select Apply and create the container!
12. Navigate to the IP address of your Synology NAS and port 8080. If you’re using Synology’s Firewall, you will have to create an allow rule for port 8080.
http://[SYNOLOGY_NAS_IP]:8080
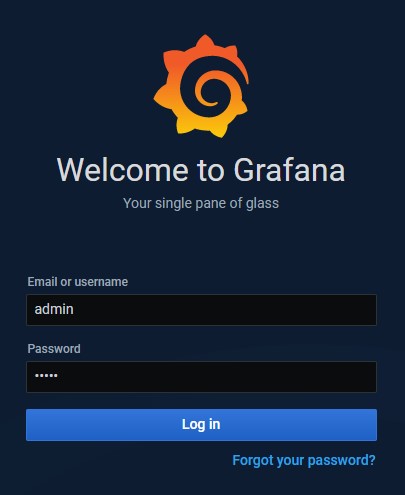
13. Log in using the username admin and the password admin. You will then have to reset the password.
14. Grafana is successfully set up! You can now start to configure your dashboards!
Conclusion
This tutorial showed how to install Grafana on a Synology NAS, but configuring Grafana to display the dashboards that you want is the hard part. There are tons of resources online that will show you how to use Grafana, so googling exactly what you need to do should help out tremendously!
Thanks for checking out the tutorial. If you have any questions, please feel free to leave them in the comments!